
Crafting effective timelines in TSLs’ Action Plans requires methodologies that consider task dependencies, planning phases, and communication strategies (Activity 8.3 of TRANSFORMER Roadmap). Key methodologies to be adopted by TSLs are listed below: such as Gantt Charts, Critical Path Method (CPM), Kanban, and Program Evaluation and Review Technique (PERT) are instrumental in this process. These approaches, along with tools like Microsoft Project, Trello, Asana, and others, ensure detailed planning and clear visualization, enhancing project management and stakeholder communication:
- Gantt chart visually represents a project’s schedule with bar charts showing task start and finish dates. They illustrate task dependencies, ensuring sequential tasks are completed correctly. This detailed planning group tasks to reflect the project’s structure. Tools like Microsoft Project, Asana, and Trello (with Power-Ups) enhance Gantt chart management, making planning and communication clear and visual[1]. For templates for Gantt chart please visit: https://create.microsoft.com/en-us/templates/gantt-charts.
- Critical Path Method (CPM) identifies the sequence of essential tasks for timely project completion, highlighting critical tasks and their dependencies. Tools like Microsoft Project, Smartsheet, and Primavera P6 support CPM by tracking dependencies and providing critical path analysis[2].Kanban uses boards to track task progress through stages, with columns indicating different workflow phases. This visual approach aids in communication by displaying task status and progress. Tools like Trello, JIRA, and Asana implement Kanban effectively[3].
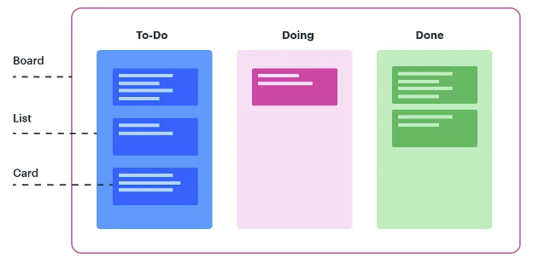
Available at: https://kissflow.com/project/agile/kanban-methodology/
- Program Evaluation and Review Technique (PERT) analyzes tasks and time required for project completion, using network diagrams to illustrate dependencies. PERT charts provide realistic scheduling through time estimates and clear visualizations, aiding stakeholder understanding. Tools like Microsoft Project, Lucidchart, and SmartDraw support PERT analysis[4].
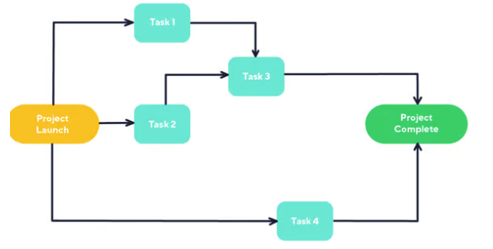
Available at: https://www.wrike.com/project-management-guide/faq/what-is-pert-in-project-management/
[1] TeamGantt (n.d.). What Is a Gantt Chart? How to Use Gantt Charts in Project Management (with Examples). Available at: https://www.teamgantt.com/what-is-a-gantt-chart
[2] Team Asana (2024). Critical path method: How to use CPM for project management. Available at: https://asana.com/resources/critical-path-method
[3] Kissflow (2023). Kanban Methodology: The Simplest Agile Framework. Available at: https://kissflow.com/project/agile/kanban-methodology/
[4] CAROL M. KOPP. (2023). Program Evaluation Review Technique (PERT) Chart Explained. Available at: https://www.investopedia.com/terms/p/pert-chart.asp